Tableau Dashboard for COVID-19 Vaccination
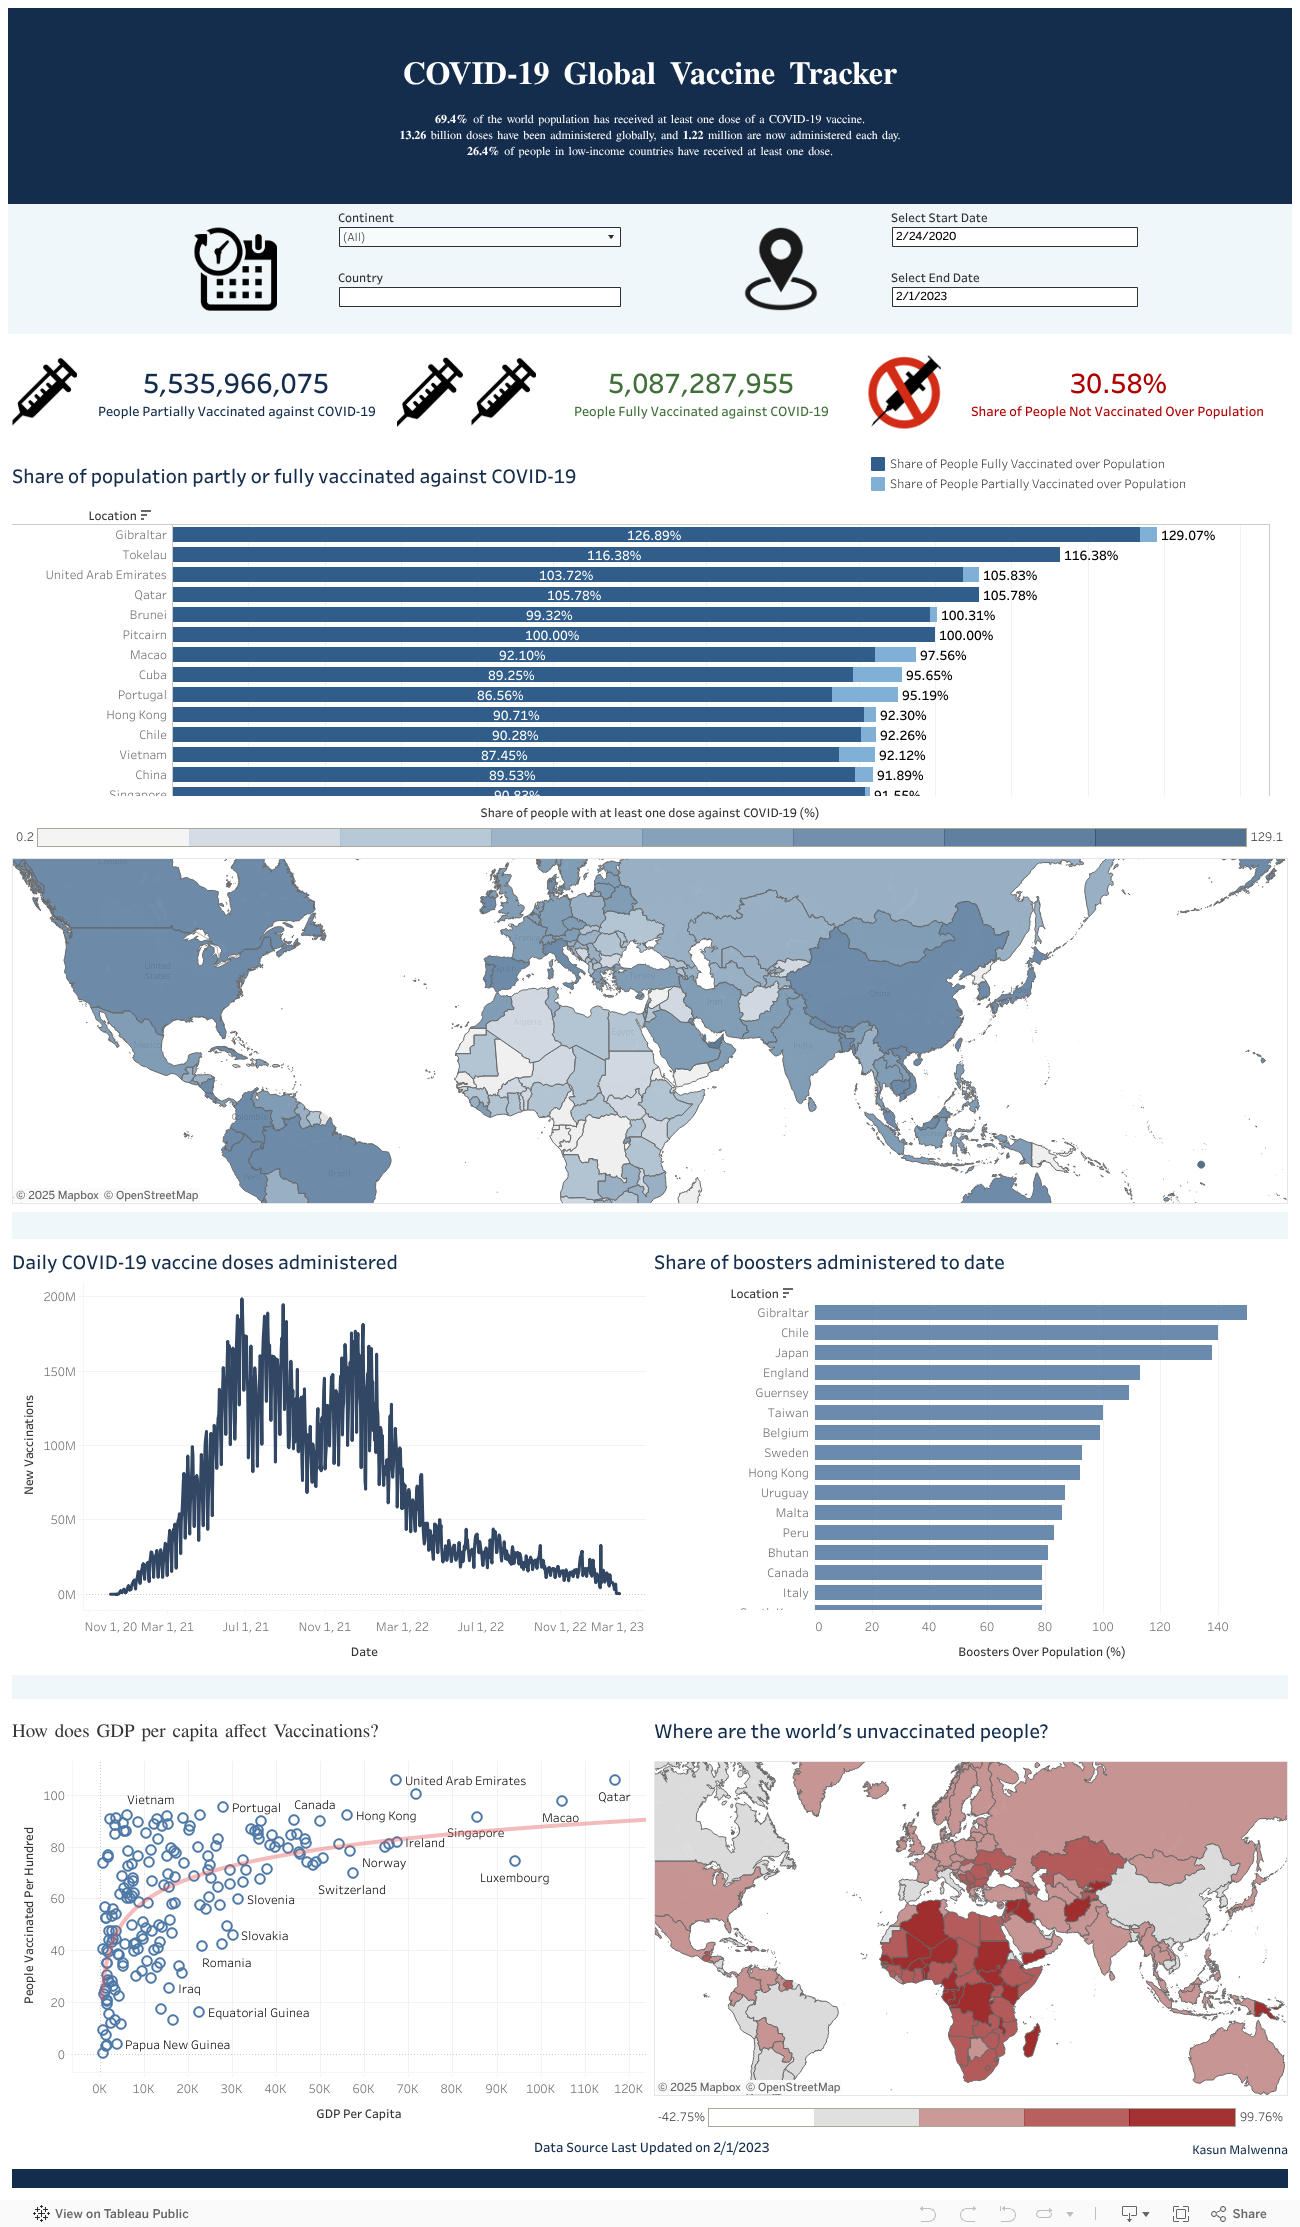
For this project, I made an interactive dashboard in Tableau to examine and show the most recent COVID-19 vaccination stats.
The data is open to the public and recently obtained from ourworldindata.org and consists of the newest figures from different governments and health organizations all around the world. The per capita measurements were based on a UN study - the World Population Prospects. Income groups were based on the World Bank’s classification.
This dashboard only utilizes data from February 24, 2020, to February 1, 2023. However, the dashboard can be updated with the latest stats as the dataset is refreshed daily each morning (London time) with records inclusive of the previous day.
Some useful links
-
Dashboard on Tableau Publik
-
Workbook and data on Github
-
Most recent data on ourworldindata.org